8/30/2011· Failure Analysis
Metal Failure Analysis: Metal Food Contaminant Failure Analysis
By: Dr. Thomas Read
Materials failure analysis expert performs a failure analysis to determine the source of a metal piece found in tomato product.


By: Dr. Thomas Read
Tel: (707) 544-2374
Email Dr. Read
During normal operation, the arm on an automatic wafer test station failed. Root cause failure analysis determined that the drive shaft on the right angle gear motor used to raise and lower the manipulator arm had failed first. The drive shaft failure allowed the manipulator arm to free fall, and it broke when the arm came to a stop at the end of the free fall. A metallurgical failure analysis was performed to determine why the drive shaft failed.
The fatigue failure occurred as a result of high side loads generated by the motor mounting procedure. Metal fatigue was aided by the fact that the coupler used was rigid and didn't allow miss-alignment of the motor base to the surface it was being bolted to. The proposed solution is to use a more forgiving motor coupler and align the mating parts more carefully to reduce bending loads on the drive shaft of the motor.
The wafer test equipment consisted of an automated wafer test head on the end of a cast aluminum (Al) arm. This arm was raised and lowered by a right angle gear motor which is rigidly coupled (i.e. with a "cage" type spline coupler) to a rotating ball slide. The digitally controlled gear motor would rotate a helical screw inside the ball slide. The rotating screw would precisely raise and lower the aluminum arm. The allowable mismatch for the splined coupler is 0.001 inch. Therefore, near perfect alignment is required. Poor alignment could apply stresses to the coupling system. In particular, bending stresses could be applied to the gear motor's drive shaft.
Figures numbers 1 through 3 show the subject gear motor and the failed drive shaft. The fracture surface of this shaft has been smeared due to post failure rubbing. Thus, a failure analysis of the fracture surface would be fruitless.
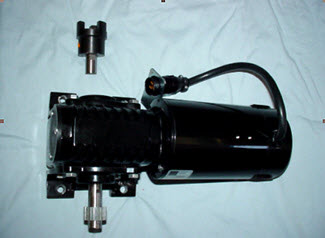
Figure #1: Photograph of subject gear motor with the failed drive shaft and one half of the rigid spline coupling, this coupling only allows 0.001 inch misalignment.
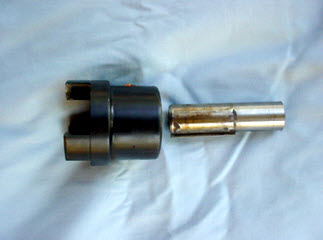
Figure #2: Close up of one half of the failed shaft and one half of the rigid spline coupling. Again, this coupling only allows 0.001 inch misalignment.
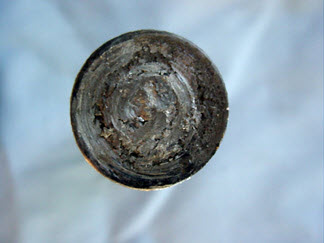
Figure #3: End view of the failed 1 inch diameter gear motor drive shaft. This view shows the surface of the metallurgical failure. The failure surface has been ruined by post failure rubbing. Therefore, a detailed failure analysis of the fracture surface would be pointless.
Even though the metal failure surface has been destroyed there are indications that this was a metal fatigue failure. There is no "overall" plastic deformation of the shaft, the metal failure is related to a stress riser on the outer diameter of the shaft and the metal failure surface is perpendicular to the motor shaft axis. The strategy described below is the path chosen to perform a root cause equipment failure analysis.
It is thought that during assembly, the technician had rested the gear motor on top of the drive used to raise and lower the arm. He did this by lifting the right angle gear motor and setting it down into the rigid coupling. At this point the gear motor is cantilevered out from the mating surface and is being held by the coupling. After this, the base of the gear motor was bolted to the equipment tower. It is hypothesized that when the gear motor base was bolted to the tower, there was significant miss-alignment between the two mating halves of the motor drive system. When the base was bolted to the tower, the rigid coupling had no allowance for the miss-alignment and bolting the two rigid systems applied a bending moment to the drive shaft. It is this moment coupled with the operating torque needed to raise and lower the aluminum arm, and the geometry of the drive shaft that caused eventual fatigue failure.
The steps taken to replicate the failure:

Figure #4: Photograph of the disassembled subject right angle gear motor. This gear motor was reassembled with a new drive shaft. It was then instrumented with load cells for deflection testing.
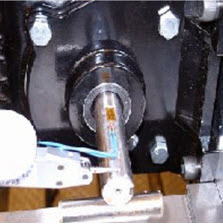
Figure #5: Photograph of re-assembled subject right angle gear motor with strain gauges cemented to the replacement shaft. This "instrumented" gear motor was used to determine the shaft deflection that had occurred during equipment assembly. It was also used to generate force-deflection data.
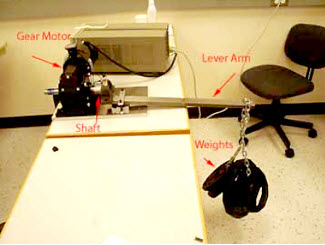
Figure #6: Photograph of one of the three fatigue test rigs used to test the gear motor drive shafts under load.
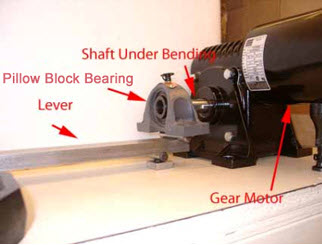
Figure #7: Close up photograph of the drive shaft under test. The number of cycles was measured by a bicycle odometer which would stop counting when the shaft broke. Force was applied to the shaft through a pillow block bearing. This located the load at the proper point on the shaft, and it allowed the shaft to turn while the side load was applied.
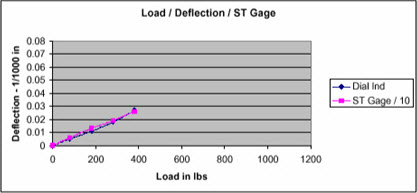
Figure #8: Load-Deflection curve generated using known loads and the instrumented motor shaft.
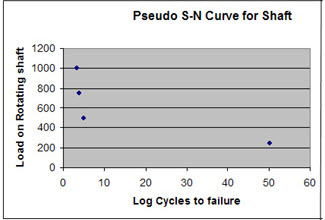
Figure #9: Curve generated by the metal fatigue tests. It plots the number of cycles to failure v. the side load in pounds. This is a practical version of what is normally called an S-N curve.
Metal fatigue testing show that the shaft will fail at a side load of 250 pounds or more. Thus, the fatigue limit of this particular system is 250 pounds. The deflection force generated as a result of the misalignment between the gear motor and the tower it was bolted to generate a side load of approximately 950 pounds. It is estimated that the lifetime use of the subject system had cycled the shaft approximately 2500 revolutions. This is very similar to the 2000 revolutions needed to break a shaft with a 1000 pound side load. Figure #9 is a photograph of a failed test shaft. It has the same appearance as the subject failed shaft without the smearing. There is no "overall" plastic deformation of the shaft, the failure is related to a stress riser on the outer diameter of the shaft and the fracture surface is perpendicular to the shaft axis.
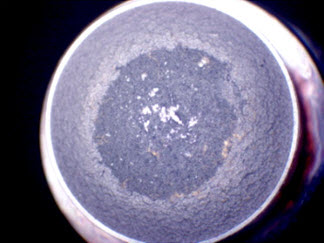
Figure #10: End view of a test gear motor drive shaft that had experienced metal fatigue. This metal failure has all the characteristics demonstrated by the subject failed motor drive shaft.
Dr. Thomas L. Read, CEO of Read Consulting received his PhD. from Stanford University in 1972. He has over 25 years of manufacturing experience in electronics, metallurgy, factory safety, failure analysis, glass fracture, glass failure and bottle failure. As a member of the electronics industry, Dr. Read has earned process patents and has an extensive background in manufacturing techniques. In parallel, he has spent over twenty five years as a consultant to attorneys and engineers in the areas of failure analysis, metallurgy, glass fracture, glass failure, bottle failure, factory safety, manufacturing problems, intellectual property and patent disputes.
©Copyright - All Rights Reserved
DO NOT REPRODUCE WITHOUT WRITTEN PERMISSION BY AUTHOR.

8/30/2011· Failure Analysis
Metal Failure Analysis: Metal Food Contaminant Failure Analysis
By: Dr. Thomas Read
Materials failure analysis expert performs a failure analysis to determine the source of a metal piece found in tomato product.
2/3/2014· Failure Analysis
By: Dr. Thomas Read
The root cause of the failure of customer returns of heated automobile rear view mirrors was investigated.
1/28/2006· Failure Analysis
By: Dr. Thomas Read
Note: Glass Fractography is the most effective method for determining why a glass object, such as a bottle, failed. This technique consists of examining the fracture surfaces of the failure for artifacts such as Wallner lines and using them to trace the crack back to its origin