Minnich and Scotto, Inc. (www.MSIAir.net) is the architect of e-Calc© – an emissions-calculation software package developed initially for use with open-path Fourier-transform infrared (FTIR) spectroscopy in order to generate air pollutant emission rates from a wide range of ground-level sources. The software, however, is equally applicable for use with a tunable diode laser (TDL) system, or any other optical remote sensing (ORS) instrument which generates a path-integrated concentration (PIC). It can also be used with a rapid sampling point monitoring device, such as a cavity ring-down spectroscopy (CRDS) system, from which a path-averaged concentration output is derived.
What Are the Benefits of Open-Path Monitoring for Calculating an Emission Rate?
The difference between a source emission rate (mass per time) and an ambient air concentration (mass per volume) is often poorly understood. Further, few investigators appreciate the full utility of the path-integrated concentration when coupled with onsite meteorology and air dispersion modeling for deriving emission rates. When properly applied, an open-path ORS instrument eliminates the spatial data-representativeness problem inherent in emission approaches which rely solely on point-sampling techniques. This path-integrated “whole-plume” measurement approach offers perhaps the only means of fully employing the U.S. EPA’s data quality objective process for generating emission rates, thereby ensuring that end-user needs are always met.
Point-type monitors typically report gaseous concentrations as the mass of contaminant per volume of air, such as milligrams per cubic meter (mg/m3), or the volume of contaminant per volume of air, such as parts per million (ppmv). Although path-integrated concentrations are often reported as parts-per-million times meter (ppm-m), it is often desirable to convert from ppm-m to milligrams per square meter (mg/m3 x m, or mg/m2) in order to avoid having to consider the compound’s molecular weight explicitly in calculating emission rates.
Emission rates derived from point monitoring data are frequently underestimated, as there is no way of knowing the proximity of a hand-held monitor (or Summa canister) to the plume centerline, especially given the fact that wind direction is never constant; in fact, it is generally not possible to ensure that the sample isn’t inadvertently collected completely outside the downwind plume. This fundamental sampling design flaw explains, at least in part, the wide variability in reported emission factors for the same process components (particularly in the oil and gas industry).
Figure 1 illustrates how the pollutant concentration at a location downwind of a small source drops off rapidly as one moves away from the plume centerline
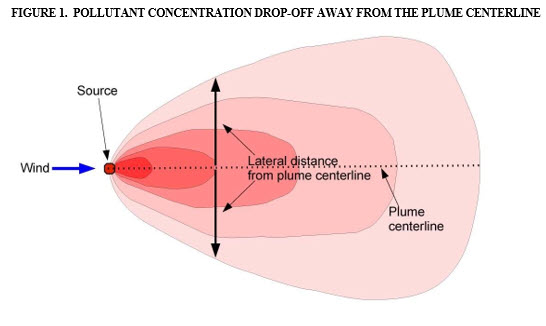
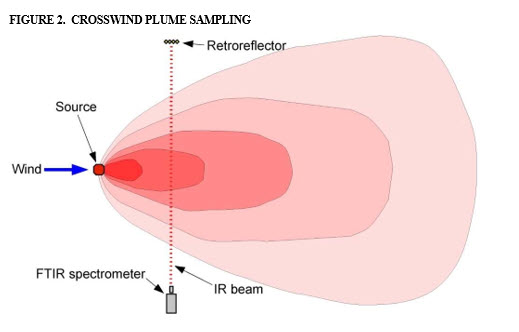
Figure 2 illustrates how the entire crosswind plume is sampled using open-path FTIR spectroscopy (or any other ORS system). The spectrometer collects path-integrated concentration data, meaning that contaminant concentrations are measured downwind of the source along the entire crosswind dimension of the plume. The spectrometer, in essence, counts the molecules of each pollutant, thus ensuring that concentrations are not “missed” anywhere along the beam path (which, for a TDL system, can extend up to a kilometer or more, depending on the application).
Open-path spectroscopy is identical to laboratory spectroscopy, except that the “sample” is measured in the open atmosphere rather than from a cell. Because analyses are performed in situ (i.e., there is no sample per se), all “sample handling” errors are eliminated (another source of negative bias), and re-analysis can be performed at any time in the future – even for compounds not monitored for originally.
Using dispersion modeling relationships, a source emission rate is “back-calculated” for a given pollutant based on the downwind (cross-plume) path-integrated concentration and the onsite meteorology representative of the precise monitoring event duration (sometimes referred to as “inverse” modeling).
What Exactly is e-Calc?
E-Calc is MSI’s proprietary, Windows-based client-server software for calculating, in real time, contaminant emission rates – precise 15-minute-averaged snapshots – from individual ground-based (or near-ground-based) sources. Originally created for use with open-path FTIR spectroscopy to help municipal solid waste landfill owners comply with mandated emissions reporting and permitting requirements for methane and other greenhouse gases, e-Calc is designed for easy use with any open- path spectrometer. As mentioned earlier, it can even be configured for “path-averaged” concentration data using a point-type monitor. The software is based on AERMOD (American Meteorological Society / EPA Regulatory Model) – the U.S. EPA’s Guideline air dispersion model for regulatory application. It incorporates path-integrated output from the spectrometer with coincident onsite meteorological data and other information.
E-Calc employs the U.S. EPA regulatory version of AERMOD in order to maintain the model’s legal Guideline status. For each monitoring event, generation of input files requires meteorological data together with emissions-characterization and monitoring configuration data. E-Calc currently assigns dispersion coefficients based on wind speed, land use, solar insolation, and statistical data treatments such as the standard deviations of the horizontal wind direction and vertical wind speed.
Figure 3 illustrates the e-Calc measurement system. Most input data is directly measured and entered into the software program automatically. Pre-identified source locations together with beam- path coordinates are manually entered into simple data input screens (not shown). The e-Calc analysis screen is utilized for entry of event-specific meteorological data leading to emissions calculations via AERMOD, as well as the subsequent generation of a hard-copy report for each monitoring event (discussed below)....
Download PDF to continue reading report, footnotes, figures, tables, and references.